Pricing Wiki
Value drivers
The specific product benefits that create utility and drive a customer's Willingness to Pay (WTP).
Snapshot
What it is
A prioritized list of specific benefits (economic, functional, risk, emotional) that drive willingness to pay (WTP) for your offering.
Why it matters
You cannot price effectively if you don't know which features create the most "Value Surplus." Founders often over-index on features and under-index on the value those features drive.
When to use
New product pricing; major packaging changes; entering a segment; sales play redesign; when defending against a competitor's price cut.
Key takeaways
Value is Relative: A value driver only exists relative to a substitute. If a competitor also offers "24/7 support," that feature is table stakes (Reference Value), not a value driver.
Quantify or Die: In B2B, you must translate features into dollars (revenue gained or costs saved). If you cannot quantify the value driver, you cannot easily charge for it.
Segment by Driver: Different customers have different value drivers for the same product. You must build separate maps per job/use case.
On this page10 sections
What are Value Drivers?#
Value Drivers are the specific attributes of a product or service that create measurable benefits for a customer and directly influence their Willingness to Pay (WTP). They act as the bridge between your product's features and the customer's wallet.
Key definitions#
-
Monetary Value Drivers: Tangible financial benefits, such as cost savings or revenue generation (e.g., "This software saves 40 hours of engineering time per month").
- Economic: Revenue lift, cost reduction, productivity/time savings, asset utilization.
- Risk reduction: Compliance, security, uptime, error rate reduction.
- Functional/quality: Speed, accuracy, coverage, integration breadth, scalability.
-
Psychological Value Drivers: Intangible benefits that create innate satisfaction, such as brand prestige, peace of mind, or ease of use (e.g., "This watch signals status").
- Experience: Ease of use, onboarding time, support SLAs, brand trust.
- Social/emotional: Peace of mind, status, community, mission alignment.
-
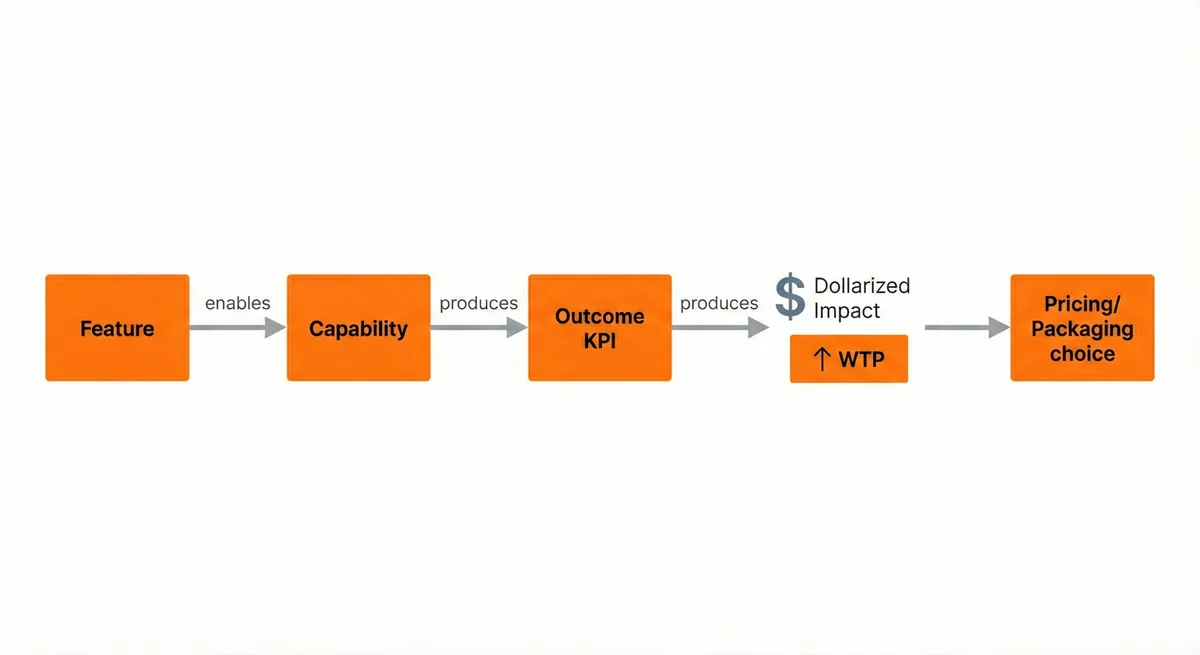
Outcome vs. feature: A feature enables an outcome; value drivers live at the outcome level.
-
Price metric: The unit you charge for (seats, usage, revenue processed) that best scales with delivered value.
-
Dollarization: Translating outcomes into monetary impact for the buyer.
Mental model / diagram#
When should you use value drivers?#
Equations & rules of thumb#
-
Value Driver Algorithm: A formula that quantifies a benefit.
◦ Example: (Reduction in Labor Hours) × (Hourly Wage of Staff) = Value of Efficiency Driver.
-
The 50/30 Rule: When pricing a solution based on value drivers, you should communicate 100% of the value created, target capturing 50% of that value in your price, and accept no less than 30%.
-
Differentiation Ratio: The value-based price premium is often much greater than the percentage increase in technical efficiency. If a machine is 2x faster but saves an entire production line from shutting down, the value driver is the shutdown prevention, not just the speed.
Why do Value Drivers matter?#
-
Avoiding Commoditization: Without clearly defined value drivers, customers default to comparing products based on price alone. Understanding value drivers allows you to price based on the economic value you create rather than your internal costs, which is the foundation of value-based pricing.
-
Product Prioritization: Identifying which features actually drive value prevents "Feature Shock"—the failure mode of cramming too many unwanted features into a product, driving up costs without increasing WTP.
-
Sales Justification: Sales teams cannot defend a price premium without articulating the quantified value drivers that justify the difference between your product and the competitor's.
Key Facts
<10 hours/year
Most companies spend <10 hours/year on pricing—leaving growth on the table.
Paddle / Price Intelligently80% of features go unused
Pendo's analysis of 615 subscriptions found roughly 80% of software features are rarely or never used—R&D spend that never mapped to a value driver anyone would pay for.
Pendo, 2019 Feature Adoption Report≥90% of needs
In a homogeneous segment, 20–30 qualitative interviews typically surface ≥90% of customer needs—enough to map value drivers.
Griffin & Hauser (1993) via MIT SloanWorked example: attributing a premium to specific drivers#
You price at $60,000/year. The incumbent the buyer would otherwise renew costs $40,000/year. You need to defend a $20,000 premium.
Quantify each driver against that alternative, annually:
| Value driver | Calculation | Annual value |
|---|---|---|
Reconciliation labor avoided | 1.5 FTE-months × $9,000 | $13,500 |
Failed-payment losses reduced | $2.4M processed × (0.90% → 0.35%) | $13,200 |
Audit preparation time | 40 hours × $150 | $6,000 |
Faster month-end close | 3 days earlier — real, not quantifiable here | — |
Total quantified | $32,700 |
Value capture = $20,000 ÷ $32,700 = 61%. The buyer keeps $12,700 of surplus, which is what makes the deal signable. Below roughly 30% capture you are donating margin; above roughly 70% the ROI case stops feeling like a bargain and procurement starts negotiating.
The part that changes what you say. Two of the four drivers carry 82% of the quantified value ($26,700 of $32,700). Audit prep is real but it is a filler driver — it belongs in the appendix, not the first slide. Most value-driver work fails not because the analysis is wrong but because the deck gives all four drivers equal airtime, which trains the buyer to weigh the $6,000 item as heavily as the $13,500 one.
The unquantified driver is worth naming anyway. Do not assign it a number you cannot defend — one soft figure in the stack invites the buyer to challenge the whole table.
How do you implement value drivers step-by-step?#
Inputs you need#
- Alternatives (NBCA): In‑house/competitor options, price levels, performance benchmarks.
- Customer economics: Loaded wage rates, gross margin, revenue per unit/time, cost of failure/downtime.
- Usage & outcome data: Feature adoption, time‑on‑task, error/incident rates, conversion deltas.
- Voice of customer: 8–12 in‑depth interviews; value stories and proof points.
- Commercial data: Cost‑to‑serve by feature/tier, discounting logs, win/loss notes.
Step-by-step
Identify the Next Best Competitive Alternative (NBCA)
Ask your customer: "If we didn't exist, who would you hire or what product would you buy?" This sets your Reference Value.
List Differentiating Features
List the features where your product performs better than the NBCA. Be honest about where it performs worse (negative differentiation).
Develop Value Driver Algorithms
Translate the differentiating features into monetary terms using customer logic.
• Feature: "Our software processes data 50% faster."
• Value Driver: "Faster processing saves 10 engineer hours/week."
• Algorithm: (10 hours) × ($150/hr cost) × (52 weeks) = $78,000 annual value.
Segment
Different customers value different drivers. A startup values speed; an enterprise values compliance. Create ROI worksheets per segment.
Quantify importance
Use MaxDiff, conjoint analysis, or WTP surveys; regress WTP on measured drivers.
Validate with "Evocative Anchoring"
In interviews, ask customers to compare your solution to other budget items to gauge perceived value. "Would you trade this software for one full-time junior employee?" This anchors the psychological value.
Metrics to monitor
Win/Loss Analysis
If you are losing deals, is it because the price is too high relative to the perceived value drivers? Or did the customer not believe the value driver existed?
Price elasticity
If you raise prices 10% and churn stays flat, you have "Value headroom."
Feature Adoption Rate
Are the features you think drive value actually being used?
LTV/CAC Ratio
High ratios often indicate strong value drivers.
Risks & anti-patterns (and fixes)#
| Pitfall | Fix |
|---|---|
Features ≠ outcomes: Demos list features; buyers can't see ROI. | Rewrite as outcome statements ("from X to Y in Z time") and instrument outcome KPIs. |
No dollarization: Price debates devolve to cost or competitor quotes. | Build an ROI calculator using Economic Value Estimation principles: (Δ time × loaded rate) + (Δ conversion × GM × volume) − Δ costs; show ranges and assumptions. |
One‑size‑fits‑all drivers: Generic tiers, heavy discounting across segments. | |
Ignoring the NBCA (incl. do‑nothing): Inflated claims, low win rate. | Quantify value vs. NBCA and inertia costs; show payback vs. status quo. |
Over‑quantifying soft drivers: Forced $ claims for "ease of use" erode trust. | Use conjoint analysis/MaxDiff or WTP surveys; support with qualitative proof and risk‑reduction proxies. |
References & Links#
Sources:#
- Anderson, J. C., Narus, J. A., & van Rossum, W. (2006). Customer value propositions in business markets. Harvard Business Review, 84(3), 90–99.
- Nagle, T. T., Hogan, J., & Zale, J. (2016). The Strategy and Tactics of Pricing (5th ed.). Pearson.
- Marn, M. V., Roegner, E. V., & Zawada, C. C. (2004). The Price Advantage. Wiley.
- Hinterhuber, A., & Liozu, S. (2012). Innovation in Pricing. Routledge.
- Ramanujam, M., & Tacke, G. (2016). Monetizing Innovation: How Smart Companies Design the Product Around the Price. Wiley.
- Ghuman, A. (2021). Price to Scale: Practical Pricing for Your High Growth Software Startup. Independently published.
Frequently asked questions
01How are value drivers different from features?
Features are inputs; value drivers are the outcomes that move WTP (time saved, revenue gained, risk reduced). Quick test: if you removed the feature but delivered the outcome via services, would customers still pay? If yes, it's a value driver. Example: "Auto‑tagging" (feature) → "2 hours saved per analyst/day" (driver). Measure: time × loaded rate × frequency; validate with before/after studies.
02B2B vs. B2C—how should I measure value drivers?
Same logic. B2B uses harder dollarization and SLAs such as ROI calculators, time‑motion studies, funnel lift A/B, deal‑level value proof (payback, NPV). B2C leans more on experience/emotion, such as discrete-choice/conjoint for brand and design utility, price elasticity from experiments, usage→retention models.
03What if segments value different things? Can I have different value drivers for different customers?
Yes, this is the definition of Value-Based Segmentation. For example, a commercial lab values a test kit for yield (profit), while a university lab values it for accuracy (publication). You should build separate maps, price metrics, and packages for each.
04What if I can't quantify the value (e.g., brand, design)?
This is Psychological Value. You measure this using quantitative research techniques like Conjoint Analysis, which forces customers to trade off specific attributes (e.g., brand vs. price) to reveal their hidden utility for that driver.
05Should I mention value drivers that competitors also have?
You should acknowledge them as "Table Stakes" or Reference Value, but do not build your pricing pitch around them. You cannot charge a premium for features that a competitor also offers; you can only charge a premium for Positive Differentiation.
06How many value drivers should I focus on?
Focus on the top 3-5 drivers that create the most differentiation. Overwhelming customers with minor benefits dilutes the power of your primary value proposition.
07Can we do this without big research budgets?
Yes, start with interviews + telemetry + a lightweight WTP survey; refine with experiments (A/B test one price metric or tier boundary in a small cohort.)
Author
Dr. Sarah Zou
Independent economist · EconNova
Commercial strategy for technical products, with a focus on pricing, unit economics, and the operating choices behind the model.
About SarahTopics
Cite this page
Suggested citation
Zou, S. (2026). Value drivers. In Understanding Value & Customers. Pricing & Monetization Wiki. https://sarahzou.com/wiki/pricing/value-and-customers/value-drivers
Open license
Reuse with attribution
This content is available for reuse. When referencing or republishing it, please credit Dr. Sarah Zou and link back to the original source.
Licensed under Creative Commons Attribution 4.0 International. You may share and adapt the material with appropriate credit.