Willingness to Pay (WTP)
WTP is the maximum price a buyer accepts; use it to set a defensible price range, design tiers, and validate pricing against unit economics.
Snapshot (TL;DR)
What it is
WTP is the maximum amount of money a potential buyer is willing to part with in exchange for the benefits provided by a product or service.
Why it matters
- It defines your "pricing ceiling"; helps you pick a price range (not a guess) and avoid over/underpricing.
- Reveals which segments value you most, so you can build tiers and price fences.
When to use
During initial Product-Market Fit (PMF) discovery, before setting/raising prices, changing packaging, launching to a new segment/geo, tightening discount policy, or when pivoting your ICP (Ideal Customer Profile).
Key Takeaways
Have the "Talk" Early: Discussing WTP with customers must happen before the product is fully engineered to prioritize features correctly.
Value is Subjective: WTP is not determined by your costs but by the customer's circumstances, alternatives, and perceived benefits.
WTP is a distribution; your job is to capture more of it with segmentation + fences.
Start simple with Van Westendorp PSM, then validate with behavior (pilots/A-B) as stakes rise.
Kill "Undeads": If WTP research shows customers won't pay a price that covers your costs, stop development immediately to save resources.
Key Facts
72% Failure Rate
72% of new products miss their revenue and profit goals because they are developed without a clear WTP strategy
Monetizing InnovationThe 5% Inclusion Gap
Only about 5% of corporate business cases contain actual data on how much customers are willing to pay; the rest are essentially guesses
Monetizing InnovationThe 1% Lever
A 1% improvement in price is the most efficient profit lever, often outperforming a 1% reduction in variable costs by more than 50%
The Price AdvantageWhat is Willingness to Pay (WTP)?
Willingness-to-pay (WTP) is the fundamental measure of the perceived value an innovation holds for a customer. It is defined as the maximum amount of money a potential buyer is willing to part with in exchange for the benefits provided by a product or service.
Unlike a "price point," which is merely a number, WTP is a distribution which indicates what customers actually value and serves as a measure of how much they value it.
- Consumer surplus:
WTP − Price(how much "extra value" the buyer keeps, or incentives to purchase). - WTP distribution: Variation across customers; shaped by use case, ability to pay, alternatives, and risk.
- Price sensitivity / elasticity: How demand changes with price.
Why does WTP matter?
For startup founders, WTP is the single most critical factor in determining whether a product will make money. The "root of all innovation evil" is the failure to put the customer's WTP at the core of product design.
Approximately 72% of new products fail because companies postpone pricing decisions until the very end of the development process, essentially hoping for profit rather than knowing it exists. Conversely, mastering WTP allows a firm to capture its fair share of the value it creates, as a mere 1% improvement in price realization can boost operating profits by approximately 10% to 11%.
- Defines pricing ceiling: WTP establishes the maximum price customers will accept, helping you pick a defensible price range instead of guessing.
- Reveals segmentation opportunities: Shows which segments value you most, enabling tiered pricing and price fences.
- Prevents product failures: Early WTP research can identify "undead" products that won't cover costs, saving development resources.
- Maximizes profit capture: Understanding WTP distribution allows you to capture more value through segmentation and strategic pricing.
Mental model
A practical mental model for WTP is the "Reasonable Price Range".
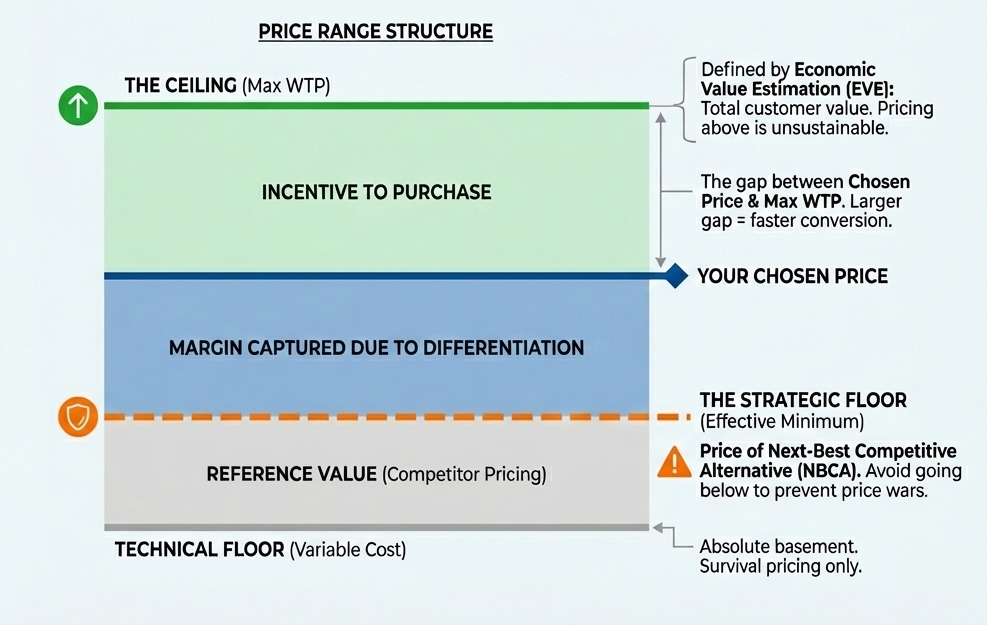
• The Ceiling (maximum WTP): Defined by the Economic Value Estimation (EVE), which equals the price of the customer's next-best competitive alternative (Reference Value) plus the worth of your product's unique features (Differentiation Value).
• The Floor (variable cost): Generally defined by the product's variable cost. However, to avoid price wars, the effective floor is often the price of the next-best competitive alternative.
• The Incentive to purchase: The gap between the chosen price and the maximum WTP.
Decision criteria (When is WTP research the right tool?)
| Your decision | Best-fit WTP approach | Use when | Watch-outs |
|---|---|---|---|
| Set a single price level | Van Westendorp (PSM), Gabor–Granger, simple A/B price test | Early-stage, one offer, limited time | PSM can be noisy; G-G can anchor; A/B needs traffic |
| Set packages / tiers | Conjoint / Discrete Choice (CBC), menu-based experiments | Multiple features/tiers; want tradeoffs | Requires careful design; analysis skill |
| Enterprise / negotiated pricing | Value-based ROI model + win/loss + quote analysis | Heterogeneous deals; sales-led motions | Hard to isolate price from discounting/politics |
| True incentive-compatible WTP | BDM / Vickrey auctions (field/lab) | Research context; can enforce real purchase | Participant comprehension + trust critical |
| Competitor-heavy markets | Conjoint with competitive sets; market simulation | Many close substitutes | Garbage-in if competitor set unrealistic |
How do you implement WTP research step-by-step?
This guidance utilizes the Van Westendorp Price Sensitivity Meter, the recommended starting point for startups due to its ability to yield high-quality results without requiring a massive customer base or sophisticated infrastructure.
Inputs you need
- Offer + unit: Crisp product description, value metric, and billing period (e.g., $/seat/month) used consistently.
- Segmentation schema: The segments you'll cut by (persona/firmographics, usage intensity, use-case urgency).
- Sampling plan: Who you'll survey (customers/prospects) and outreach math to reach ~150 responses per segment.
- PSM survey draft: The 4 Van Westendorp questions + a few segment questions + attention/comprehension check.
- Validation constraints: Growth-loop friction sensitivity + unit economics (cost-to-serve, CAC payback) + competitive reference point.
Methods
- Foundational interviews: 10–12 per segment to define use cases, alternatives, "why," and the value metric.
- Van Westendorp PSM: 4 price-perception questions to estimate PMC–PME (acceptable range) and OPP.
- Validation (and optional depth): Pilot/A-B/live rollout to calibrate; use conjoint/DCE when packaging complexity is high.
Step-by-step
Conduct foundation qualitative research (before any survey)
Run 10–12 interviews per key segment to nail the use case, persona, and current alternatives; identify the core "why" (time, money, risk, status); and lock a clear value metric and billing period (e.g., $/seat/month) so your survey is anchored to a real unit of value.
Draft the Van Westendorp survey (don't ask "How much would you pay?")
Paste a short offer description (what's included, value metric, monthly vs annual) and then ask the four canonical questions: the price that's too expensive to consider, too cheap to trust, expensive but still possible (needs thought), and a bargain (great value), plus a few segment questions and a simple attention/comprehension check. See Van Westendorp Price Sensitivity Meter for detailed guidance.
Define the audience and sample size
If you're defending retention, survey current customers; if you're expanding or changing packaging, survey customers and prospects; if you're entering a new market, survey prospects only—then aim for about 150 responses per segment (and plan outreach accordingly, e.g., ~1,500 invites per segment at a 10% response rate).
Field the survey and clean the data
Ensure every respondent saw the same context (offer + period), then remove speeders and inconsistent answers, and investigate extreme values that often come from unit confusion (e.g., monthly vs annual, per seat vs per company).
Plot the Price Sensitivity Meter and read the intersections
Create cumulative curves over price and identify the acceptable range between the Point of Marginal Cheapness (PMC) (Too Cheap × Not a Bargain) and Point of Marginal Expensiveness (PME) (Too Expensive × Not Expensive), and the Optimal Price Point (OPP) where Too Cheap intersects Too Expensive—using curve stability and separation as a quick confidence check.
Segment results to find the real story
Re-run the PSM outputs by persona/firmographics, usage intensity, and urgency of the use case to reveal different acceptable ranges and OPPs, then translate those differences into an initial price-fence plan (tiers, limits, SLA/support, contract terms).
Validate against growth and unit economics
Pressure-test whether the chosen price will slow acquisition/virality/activation in your growth model and confirm it clears cost-to-serve and CAC payback constraints; then decide on a single price vs a tier ladder and draft the rollout plan (grandfathering, discount policy, messaging).
(Optional) Add advanced validation
For higher stakes or more complex packaging, use conjoint/DCE to simulate bundle choices and estimate feature-level WTP, and/or run live testing (A/B price tests, sales pilots, controlled rollouts) to calibrate stated WTP against observed behavior.
Metrics to monitor
Pocket Price Band
The range of actual net prices realized across your customer base; a wide band indicates high opportunity for optimization.
Discounting Percentage
The amount of revenue leaked between list price and pocket price.
Price Elasticity
After launch, track how volume changes with small price tweaks to find the profit-maximizing point. See Price Elasticity for more details.
Risks & anti‑patterns (and how to fix them)
| Pitfall | Fix |
|---|---|
| The Average Trap: Designing a product for the "average" customer, which usually results in a product that appeals to no one. | Segment your market by WTP and create tiered versions (Good-Better-Best). Always produce a distribution + segment cuts; design fences. |
| Cost-Plus Bias: Basing your price on a markup of your internal costs. | Flip the process; let the market WTP dictate the costs you can afford to incur. See cost-plus pricing for why this approach fails. |
| The "Kiss of Death": Taking polite, non-committal feedback (e.g., "That's a great idea") as a signal of WTP. | Require "skin in the game" through paid pilots or pre-orders. |
| Grandfathering Indefinitely: Leaving early customers on low "legacy" prices as your product value increases. | Use dynamic contracts that allow for regular, value-based price updates. |
References & Links
Sources
- Becker, G. M., DeGroot, M. H., & Marschak, J. (1964). Measuring utility by a single-response sequential method. Behavioral Science, 9(3), 226–232.
- Murphy, J. J., Allen, P. G., Stevens, T. H., & Weatherhead, D. (2005). A meta-analysis of hypothetical bias in stated preference valuation. Environmental and Resource Economics, 30, 313–325.
- Wertenbroch, K., & Skiera, B. (2002). Measuring consumers' willingness to pay at the point of purchase. Journal of Marketing Research, 39(2), 228–241.
- Van Westendorp, P. H. (1976). Price Sensitivity Meter (PSM): A new approach to study consumer perception of prices. Proceedings of the ESOMAR Congress.
- Nagle, T. T., Hogan, J. E., & Zale, J. (2016). The strategy and tactics of pricing (6th ed.). Routledge.
- Ramanujam, M., & Tacke, G. (2016). Monetizing innovation: How smart companies design the product around the price. Wiley.
- Mohammed, R. (2005). The art of pricing: How to find the hidden profits to grow your business. Crown Business.
- Ghuman, A. (2023). Price to scale: Practical pricing for B2B SaaS founders. Independently published.
- Lehrskov-Schmidt, U. (2021). The pricing roadmap: How to design B2B SaaS pricing. Independently published.
Related pages: Value-Based Pricing | Customer Use Cases | Conjoint Analysis | Van Westendorp Price Sensitivity Meter | Gabor–Granger | Price Elasticity | Price Fences
Frequently Asked Questions
Is WTP the same as value?
No. Value is benefit created; WTP is the share of value a buyer will give you given alternatives and constraints.
Is WTP a single number?
No. WTP is a distribution. Different segments will have different "cliffs" where they stop buying.
Does WTP change over time?
Yes. It shifts based on market environment, customer income, and your own product's maturity.
Can I just ask "What would you pay?"
No. Direct questioning usually results in low-balling or "guesswork" answers. Use indirect methods like Van Westendorp or Conjoint instead.
How big should my sample be?
Enough to segment. As a starting heuristic: 200–400 responses for a single-market study; more if you need multiple segments.
Should I set my price exactly at the WTP ceiling?
Rarely. You must leave some "consumer surplus" as an incentive for the customer to choose you over the competitor.
How do I estimate WTP in enterprise sales?
Combine a value/ROI model, win/loss interviews, quote data, and discount discipline; then test via price guidance + controlled pilots.
How often should we redo WTP work?
When the product, competitive set, or customer mix changes materially—otherwise, refresh annually and continuously calibrate with behavioral metrics.

Ready to build a powerful revenue engine?
Stop guessing and start growing. Let's build a monetization strategy that unlocks your startup's true potential.
Book Your SprintReuse & Attribution
This content is available for reuse with attribution. When referencing or republishing, please credit Dr. Sarah Zou and link back to the original source.
Licensed under Creative Commons Attribution 4.0 International. You are free to share and adapt this material, provided you give appropriate credit.
Category
Understanding Value & CustomersLast Updated
December 29, 2025
Reading Time
8 minutes
Tags
Dr. Sarah Zou
EconNova Consulting
PhD economist specializing in pricing and monetization strategy for tech startups. Helping startups and scale-ups optimize their pricing for maximum growth.
Learn more about Sarah →Need help with your pricing strategy?Book a consultation →