Economic Value Estimation (EVE)
A structured method to quantify monetary value vs the next‑best alternative so you can set value‑based prices.
Snapshot (TL;DR)
What it is
Economic Value Estimation (EVE) is a framework for quantifying how much money your product makes or saves a specific customer segment versus their next‑best alternative.
Why it matters
- Avoids chronic underpricing by anchoring on customer value instead of cost.
- Equips sales with simple, credible ROI narratives instead of feature lists.
When to use
- Initial product-market fit stages, or re‑pricing a product with clear economic impact (saves time, cuts costs, increases revenue, reduces risk).
- Entering a new segment or geography with very different economics.
- Preparing for moving upmarket to large B2B deals where procurement will ask for ROI.
- When a major competitor changes their pricing.
Key Takeaways
It's Relative, Not Absolute: Your value only exists in comparison to what the customer would do otherwise.
Solve for Dollars, Not Features: EVE quantifies "soft" benefits (hours saved, scrap avoided, higher conversion, lower churn, fewer incidents) into "hard" dollar outcomes.
Create incentives: Capture only a portion (~10–50%) of the value created to ensure an "incentive" for the customer to switch.
Key Facts
+8.7% profit boost
A widely cited McKinsey analysis found that a 1% price increase boosted operating profit by 8.7% on average (vs. 2–8% for similar cost or volume changes).
McKinsey (2014)30% pricing failures
Up to 30% of the thousands of pricing decisions companies make each year fail to deliver the best price, leaving significant value uncaptured.
McKinsey (2014)70–90% launch failures
Various studies suggest that 70–90% of new product launches underperform, with misaligned pricing and weak value articulation recurring among the drivers.
HBR (2006)What is Economic Value Estimation (EVE)?
Economic Value Estimation (EVE) is a strategic framework used to calculate the maximum price a "smart shopper," who is fully informed and seeking the best value, would pay for a product or service.
The estimated value is called Total Economic Value, composed of two primary elements: the Reference Value, which is the price of the customer's next-best competitive alternative (NBCA), and the Differentiation Value, which represents the net worth of the specific features that distinguish an offering from that alternative.
Key definitions
-
Next‑Best Competitive Alternative (NBCA): The realistic option the customer would pick if they did not buy from you (e.g., specific competitor, in‑house solution, manual workaround, "do nothing but continue current process").
-
Reference Value: The price of the next‑best alternative for the same scope and volume. This is your economic "floor" – customers expect at least this much value.
-
Differentiation Value: The incremental economic impact of choosing you instead of the NBCA. It can be categorized into Monetary Value and Psychological Value, or into positive and negative value drivers.
- Monetary Value: Tangible financial gains like cost savings or increased income.
- Psychological Value: Intangible benefits like prestige, security, or satisfaction.
- Positive value drivers: Where you outperform the NBCA (e.g., less rework, higher conversion, reduced downtime).
- Negative value drivers: Where you underperform (e.g., onboarding effort, switching costs, extra training, new risks).
-
Share of value captured: The portion of incremental economic value reflected in your price premium over the NBCA.
Why does EVE matter?
For startup founders, EVE is essential to move from "hoping" a price works to "knowing" it is justified by value.
-
Escapes cost-plus thinking: Helps founders move beyond cost-plus pricing, which often underprices high-value or innovative products.
-
Connects features to dollars: Translates product benefits into concrete financial impact on the customer’s P&L or life, not just a feature list.
-
Justifies higher prices: Provides a quantified logic for pricing, turning "I hope this works" into "I can show why this price is fair."
-
Enables value selling: Arms sales and founders with a simple storyline for ROI decks, fundraising, and enterprise procurement.
-
Critical for novel products: Especially vital for revolutionary products where customers have no experience to judge value and may initially perceive the offering as overpriced without a quantified justification.
Mental model
Think of a vertical "Value Stack" chart:
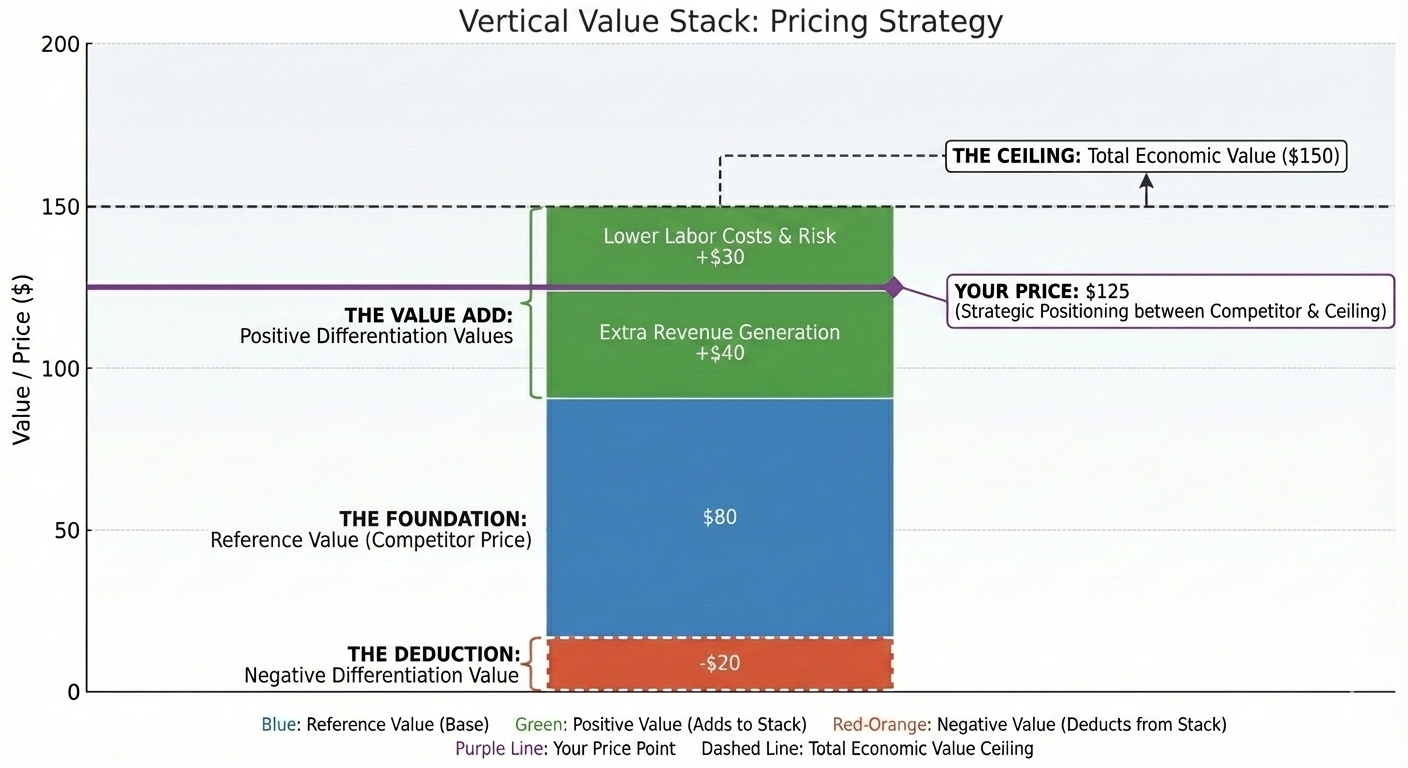
- The Foundation: The bottom block is the Reference Value, the price of the competitor's product, say $100.
- The Value Add: Above the foundation, you stack blocks representing Positive Differentiation Values (e.g., extra revenue, lower labor, lower risk, say $70 in total as shown in the chart).
- The Deduction: If a competitor's product is superior in some minor way, a small slice is removed from the top, representing Negative Differentiation Value (e.g., switching costs, extra modules needed, say $20).
- The Ceiling: The very top of this stack is the Total Economic Value, the price ceiling for your most informed customers, that is, $150 in the chart.
- Your price should sit somewhere between the alternative's price and total economic value, depending on your positioning and bargaining power.
Equations & rules of thumb
Core equation
Price premium vs. alternative
Share of incremental value captured
Rule‑of‑thumb bands (B2B / SaaS)
The 50/50 Rule: While EVE establishes the ceiling, founders should typically target capturing roughly 50% of the differentiation value as a fair price premium, ensuring the customer still has a strong "incentive to purchase". Specifically,
- Highly differentiated, proven ROI, low competitive pressure: capturing 40–60% of incremental value can be feasible.
- Credible but newer solution or more competition: 20–40% share of incremental value is more typical.
- Commodity‑like offers or high perceived risk: expect to capture <20% of incremental value.
Avoid Proportionality: Never assume that a 50% increase in technical efficiency only justifies a 50% price increase; the economic value of saved time or reduced risk is often much higher than the price of the tool itself.
These are guidelines, not laws—realistic shares depend on risk, switching friction, and buyer sophistication.
💡 Related: See Value Decoder vs. Economic Value Estimation (EVE) for a detailed comparison of these two value-based pricing frameworks and when to use each.
Decision criteria (When EVE is the right tool?)
| Situation / Question | Is EVE a good fit? | What to do |
|---|---|---|
| Product has clear, quantifiable impact on cost, revenue, or risk | Very high | Build a full EVE model and anchor list prices and discount policy on it. |
| New B2B product with few direct competitors | High | Use EVE to benchmark against the dominant status quo or manual workaround. |
| Fast‑moving B2C product with small ticket size | Lower | Use EVE for internal strategy, but rely on A/B tests and behavioral pricing in market. |
| Procurement‑driven deals with heavy ROI scrutiny | Critical | Make EVE the backbone of your customer business cases and proposals. |
| Mostly emotional or brand‑driven value (e.g., fashion) | Limited | Use EVE cautiously and complement it with research on willingness to pay and brand positioning. |
Use EVE when economic logic is a major part of the buying decision, especially for B2B software, services, equipment, and process improvements.
How do you implement EVE step-by-step?
Inputs you need
At minimum, for one well‑defined customer segment and use case:
- Next-Best Competitive Alternative (NBCA): Identify exactly what the customer would do if your product didn't exist (including "do nothing"). NBCA's product or process, including price and commercial terms (bundles, volume discounts, service levels).
- Differentiated Features: A list of every attribute that makes your product unique.
- Hypothesized levers: Time saved, error reduction, yield improvement, conversion lift, lower churn, lower downtime, fewer compliance issues, etc.
- Customer Business Model Data: Hard industry data on customer labor costs, machine downtime costs, conversion rates, churn, or revenue-per-unit to fuel value algorithms.
Methods (typical toolkit)
-
In-Depth Qualitative Interviews: Interview 10–15 customers or prospects in the same segment, probing how customers use products to uncover "unarticulated" needs and financial impacts.
-
Value Driver Algorithms: Simple formulas that translate product performance into customer dollars (e.g., hours saved per year × labor rate)
-
Complementary research methods
- Gabor‑Granger or Van Westendorp to sanity‑check willingness to pay against EVE results.
- Conjoint / discrete choice for complex multi‑attribute offerings.
- A/B testing different price points within the EVE‑suggested range.
Step-by-step
Define the customer segment & [use case](/wiki/pricing/value-and-customers/customer-use-cases)
Example: "Mid‑market e‑commerce brands, 20–200 employees, using our analytics tool to optimize ad spend."
Identify NBCA and determine reference price
Pick the competitor the customer would likely buy instead. Document its typical price, contract terms, and key pros/cons.
Identify Discriminating Value Drivers
Determine which features create the most significant financial or psychological difference for the customer.
Develop Value Driver Algorithms
For each driver, define: Mechanism (e.g., "higher conversion rate from better recommendations"), Unit basis (e.g., "additional orders per month" or "hours saved per support rep"), Magnitude (conservative and expected % change, e.g., +3% to +7% conversion), and Monetization (how to translate into dollars, e.g., gross margin per order, fully loaded hourly wage). Use customer data where possible; otherwise start with conservative assumptions and refine.
Build the economic value equation
Calculate annual impact of each driver, and then combine the reference price and the net differentiation values to find your maximum theoretical price for that segment.
Choose your target price band
Compute the incremental value: Economic Value − Reference Value. Decide what share of incremental value is appropriate given your differentiation strength and uniqueness, customer risk and switching costs, and competitive intensity and budget constraints. Result: a price corridor (e.g., $18k–$24k ARR) instead of a single magic number.
Mini numeric example (illustrative)
Assume you sell a B2B analytics tool. For a typical customer segment:
-
NBCA: Competitor tool at $20,000/year.
-
Positive drivers (vs. NBCA):
- +3% uplift in online conversion → +$60,000/year gross profit.
- 0.5 FTE marketing analyst time saved → +$40,000/year.
-
Negative drivers:
- Extra onboarding effort in year one → −$10,000 (internal time).
Then for a one‑year horizon:
- Reference value = $20,000 (competitor price).
- Total positive differentiation = $100,000.
- Total negative differentiation = $10,000.
- Economic value = 20,000 + 100,000 − 10,000 = $110,000.
If you aim to capture 30% of incremental value:
- Incremental value = 110,000 − 20,000 = $90,000.
- Price premium target = 0.30 × 90,000 = $27,000.
- Target price ≈ $47,000/year.
Your actual list price might be slightly above this (to allow room for discounts) or tiered (e.g., 49k / $59k) depending on strategy.
Metrics to monitor
Price Realization Gap
The difference between your actual transacted price and the EVE-calculated ceiling.
Win/Loss Ratio per Segment
Tracking how win rate changes as you move toward the upper or lower end of the EVE corridor.
Customer ROI
Post-purchase validation to see if the customer actually achieved the labor or cost savings predicted in your EVE model
Churn and expansion by "value fit"
Do customers with strong EVE business cases churn less and expand more?
Risks & anti‑patterns (and how to fix them)
| Pitfall | Fix |
|---|---|
| Ignoring the Status Quo: Forgetting that "doing nothing" is often the strongest competitor. | Calculate the cost of the customer's current manual process as the Reference Value. |
| Ignoring negative value drivers: Only positives are modeled, so buyers discount your ROI stories heavily. | Explicitly list switching costs, learning curve, and risks; include them in the EVE model and show you have accounted for them. |
| The "Average" Trap: Using one generic model for all segments. Same assumptions are applied to very different customer sizes or industries, leading to nonsense value estimates. | Build segment‑specific EVE templates (e.g., SMB vs. enterprise, industry A vs. B) with tailored economics. See segmentation strategies. |
| Treating EVE as a one‑off exercise: A beautiful model is built for launch, then never updated as product and market evolve. | Set a review cadence (e.g., annually or after major releases); update EVE with latest data and win/loss insights. |
References & Links
Sources
- Gourville, J. T. (2006, June). Eager sellers and stony buyers: Understanding the psychology of new-product adoption. Harvard Business Review. Link
- Liozu, S. M. (2019). Ten golden rules of EVE models. Professional Pricing Society Publications.
- McKinsey & Company. (2003). The power of pricing. McKinsey Quarterly. Link
- McKinsey & Company. (2014, June 1). Using big data to make better pricing decisions. McKinsey Quarterly. Link
- Nagle, T. T., & Müller, G. (2018). The strategy and tactics of pricing: A guide to growing more profitably (6th ed.). Routledge.
Related pages: Value‑Based Pricing | Customer Use Cases | Willingness to Pay (WTP) Measurement | Van Westendorp Price Sensitivity Meter | Gabor‑Granger Price Testing | Conjoint Analysis & Discrete Choice Experiments | Price Fences & Segmentation | ROI Calculators and Value Selling
Frequently Asked Questions
Is EVE the same as value‑based pricing?
No. Value‑based pricing is the broader philosophy of setting prices based on customer value. EVE is a specific tool to quantify that value economically, usually versus a defined alternative.
Can I do EVE without perfect data?
Yes. Most teams start with reasonable, conservative assumptions grounded in a few customer interviews and then refine as they get more data. It is better to be roughly right and explicit than to ignore value altogether.
Is EVE only for large enterprise deals?
No, but EVE is especially powerful in B2B and high‑ticket decisions where buyers care about ROI. For high‑volume, low‑ticket B2C products, EVE is more useful for internal pricing guidance than for individual customer conversations. Founders must rely more on quantitative trade-off research (like conjoint) to estimate the high psychological values often present in B2C.
How often should we update our EVE models?
As a rule of thumb, review and update EVE at least annually and whenever a competitor changes their price, or when you launch new features or new tiers, or when you enter a new segment or geography, or when you see sustained shifts in input costs, customer economics, or competitive offers.
How does EVE relate to willingness‑to‑pay (WTP) studies?
EVE provides a theoretical, economics‑based ceiling grounded in business impact. WTP research tells you what customers will actually pay given perceptions, risk, and alternatives. Good pricing work uses both: EVE to define a rational range, WTP to pinpoint a feasible price within it. WTP is often lower due to a lack of information or poor value communication.
Can I price at the EVE ceiling?
Only if you have a monopoly or provide a "have-to-have" survival product; in most markets, you must leave a portion of the value with the customer as an "incentive to purchase"
What if there is no direct competitor?
Your Reference Value is the "Status Quo." Calculate the cost of labor, time, and errors in the manual way the customer currently solves the problem.

Ready to build a powerful revenue engine?
Stop guessing and start growing. Let's build a monetization strategy that unlocks your startup's true potential.
Book Your SprintReuse & Attribution
This content is available for reuse with attribution. When referencing or republishing, please credit Dr. Sarah Zou and link back to the original source.
Licensed under Creative Commons Attribution 4.0 International. You are free to share and adapt this material, provided you give appropriate credit.
Category
Understanding Value & CustomersLast Updated
December 27, 2025
Reading Time
9 minutes
Tags
Dr. Sarah Zou
EconNova Consulting
PhD economist specializing in pricing and monetization strategy for tech startups. Helping startups and scale-ups optimize their pricing for maximum growth.
Learn more about Sarah →Need help with your pricing strategy?Book a consultation →